Author: Ton Lecluse 

    Plane geometry


Introduction
The construction box
Plane geometry
Investigating a section
Investigating a function
Drawing in perspective
A probability tree
The calculator
Getting a taste
Downloads
Register
Back to start


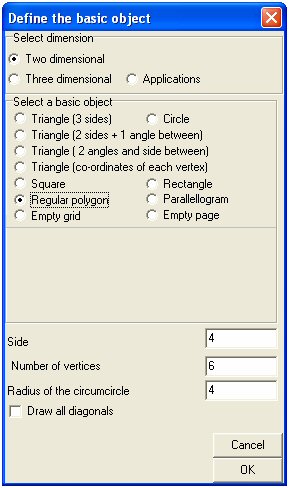
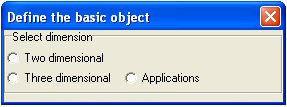
You have a choice between working with two-dimensional or three-dimensional figures. (The third possibility will not be discussed in this booklet.)

We will be working with two-dimensional figures.

Choose the option regular polygon. Check the same boxes as in the screen alongside and click [OK].


To the right of the drawing a toolbar will appear. This will help you to determine:

  • The thickness of the lines
  • For future points to be open or closed
  • The radius of future points
  • The fill style
  • The drawing method
  • The drawing colour
  • The line style

This bar is where you determine how future details are drawn.
 

You can also use it to change existing features. This is how it works:

Choose the colour red and a thicker
     line
.
Now right-click on one of the line
    segments in the drawing.
A menu will appear that allows you to
    choose an action
Choose ‘change’ and the line segment
    will become red and thicker.

Remember:

After having chosen the desired configuration in the toolbar, you can change the way a line or point was drawn by pressing the right mouse button and selecting the appropriate changes in the menu that will appear. 

Once Geocadabra has been authorised, the option maintenance in the upper most toolbar will also become available. Pressing this button will result in an extensive menu that lists all the available commands for points, lines, angles, circles, surfaces, functions and many more.

Unfortunately, this option is not available in this demo. The toolbar above the drawing consists of a lot of buttons and we will now continue to explain their various functions.
 

The ‘drag button’. Click it and place the mouse over vertex (angular point) A of the polygon. Now move the mouse about while pressing the left mouse button. Point A will move along with the cursor and the drawing will change but it still remains a regular polygon.

One point animation. Click it and put the mouse over vertex A of the polygon. Move the mouse again while pressing the left mouse button and a spring will appear. As soon as you let go of the mouse button vertex A will be launched and thus changing the drawing. However, it still is a polygon.


This is what we call dynamic geometry: even though you move one point, all characteristics of the drawing remain unchanged. In this case we still have the drawing of a regular polygon.

Please note that only vertex A can be moved. This is because vertex A is a so-called independent vertex and all the other points are dependent, they are dependent of A. An independent vertex can be recognised by the text “this point?” that will appear when the cursor is close to it (of course, you will need to have pressed the “one point animation button” first!). Dependent vertices do not get that text.
 

We are going to take a look at the menu’s hidden in the upper most toolbar.

Click view and choose toolbars, measure tools

A box will appear in which you can activate several gauges:

Length gauge: use this to measure the distance between two points;

Gonio gauge: drag vertices of gauge to measure angles;

Area gauge: use this to measure the area of, for instance, triangles and quadrangles.


Choose a measure tool and drag the vertices of the gauge to those of the polygon and determine distances and areas.

Why not try the following:

Change the length of the sides of the polygon to about 4;

Measure the angle CAE;

Determine the area of the polygon. 

For those of you who like a twist; why not click on a vertex with the right mouse button? In the menu that will appear, click “Object” and “Rotate object around the centre…”